The last new all-time high for the S&P 500 was on January 3, 2022.
That means it’s been almost 450 days since we’ve experienced new highs in the stock market.
That feels like a long time.
But based on the history of bear markets, it’s really not all that long. It might be a while until we hit new highs again if we use history as a guide.
I looked at every bear market going back to 1950 to see how long it has taken for the market to reach new all-time highs from the previous peak.
This table looks at the drawdowns for each bear market, the number of days it took to go from peak to trough and the number of days to go from the prior peak to new highs:
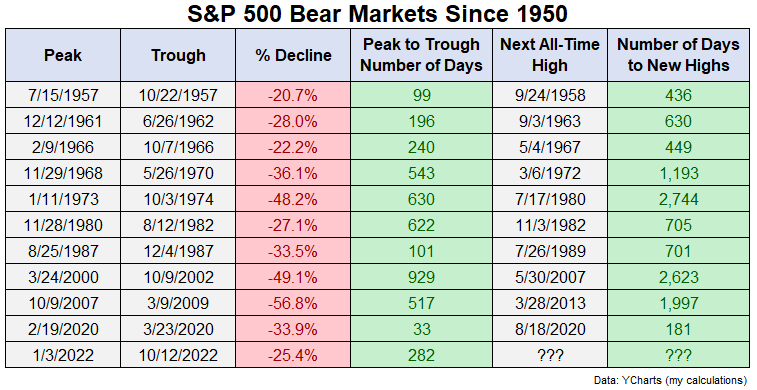
If we include the current bear market the average peak-to-trough drawdown is a loss of a little less than 35%.
The average number of days to go from peak to trough is 381, so just over a year.
The average number of days to go from the previous peak to new all-time highs is 1,166 days or more than 3 years.
The shortest roundtrip from peak to peak was the Covid crash in March 2020. We saw new highs in 6 months. Before that slingshot of a bear market, the shortest amount of time to see new highs again was 436 days in 1950.
So it can take some time to fully recover from a bear market.
I don’t know how long this one will take but it’s not out of the ordinary for the stock market to make you feel terrible on a regular basis.
One of my favorite long-term stock market charts shows the historical win rate over various time horizons:

Historically speaking, the longer your time horizon, the better your chances of seeing positive returns.
On a daily basis, the historical win rate is only around 55%, meaning 45% of all trading days have been losses. And just 5% of all trading days have closed at new all-time highs.
Basically, the more often you look at your investments in the stock market, the worse it is going to make you feel since we spend so much time in a state of drawdown.
Richard Thaler’s behavioral finance term for this phenomenon is myopic loss aversion.
Loss aversion is the idea that losses sting twice as bad as gains make us feel good. And myopia is the idea that the more frequently you look at your portfolio, the more likely you are to experience the sting from loss aversion.
The more you look the worse you’re going to feel about your performance.
And the less you look the more often you’re going to see gains over time.
Plus, it’s not like paying more attention to your portfolio will guarantee better results. For most investors, paying more attention can lead to more mistakes because that myopic loss aversion tempts you into making more changes to your portfolio, which can lead to more mistakes from your emotions.
It’s not easy to ignore your investments or the stock market in this day and age. Information is everywhere.
But the less you look the better you will feel about your performance.
Disclaimer: This blog was originally published on https://awealthofcommonsense.c…by Ben Carlson and has been republished with permission.